
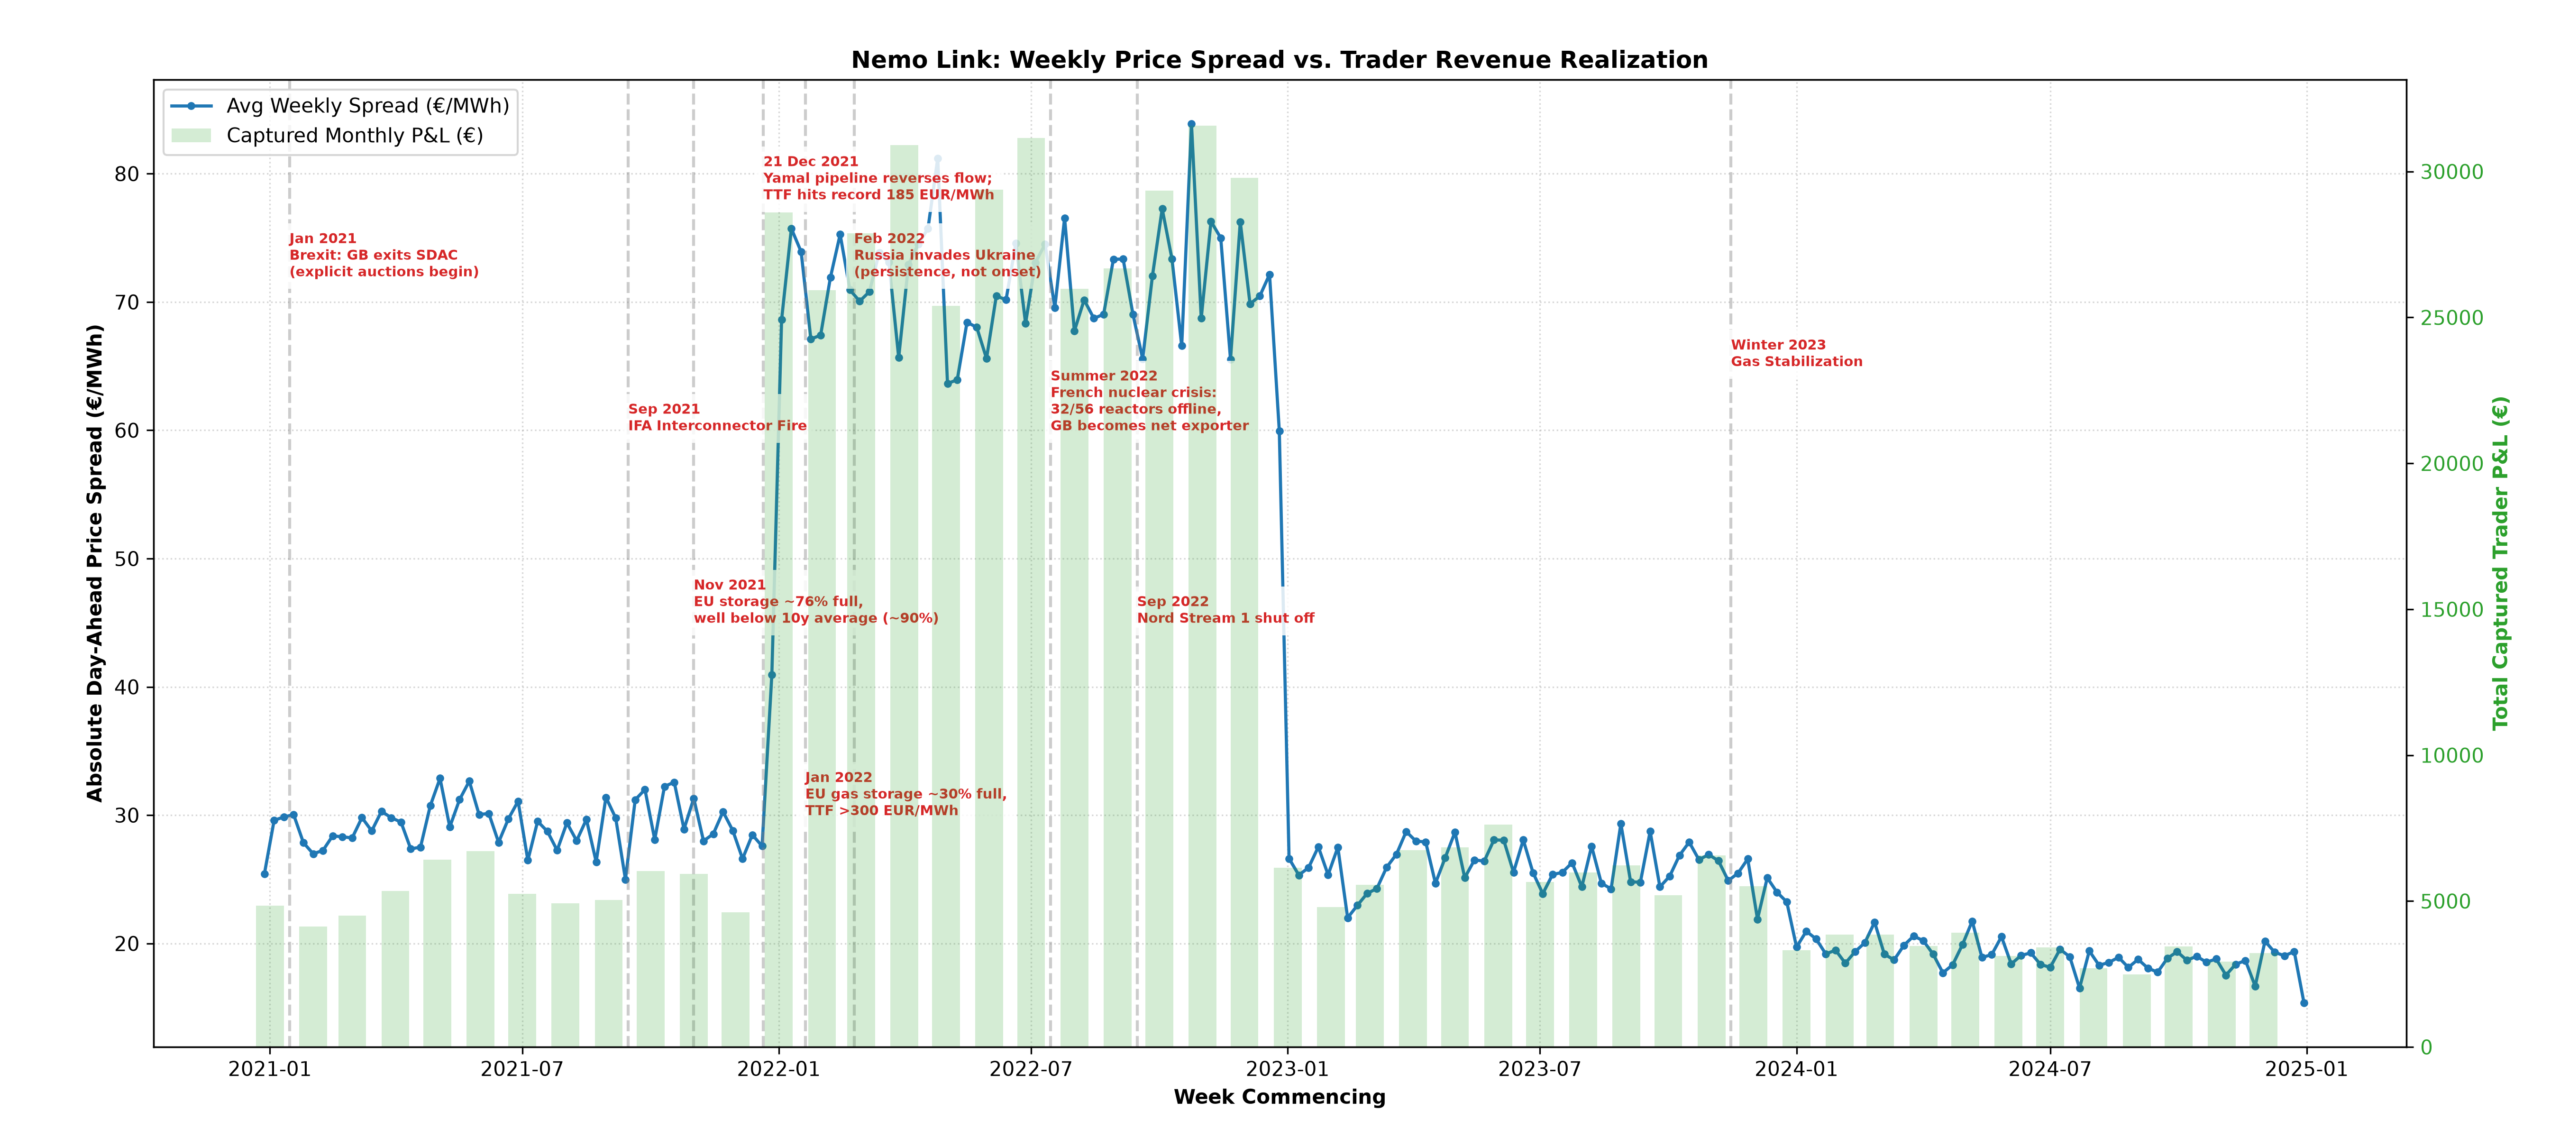
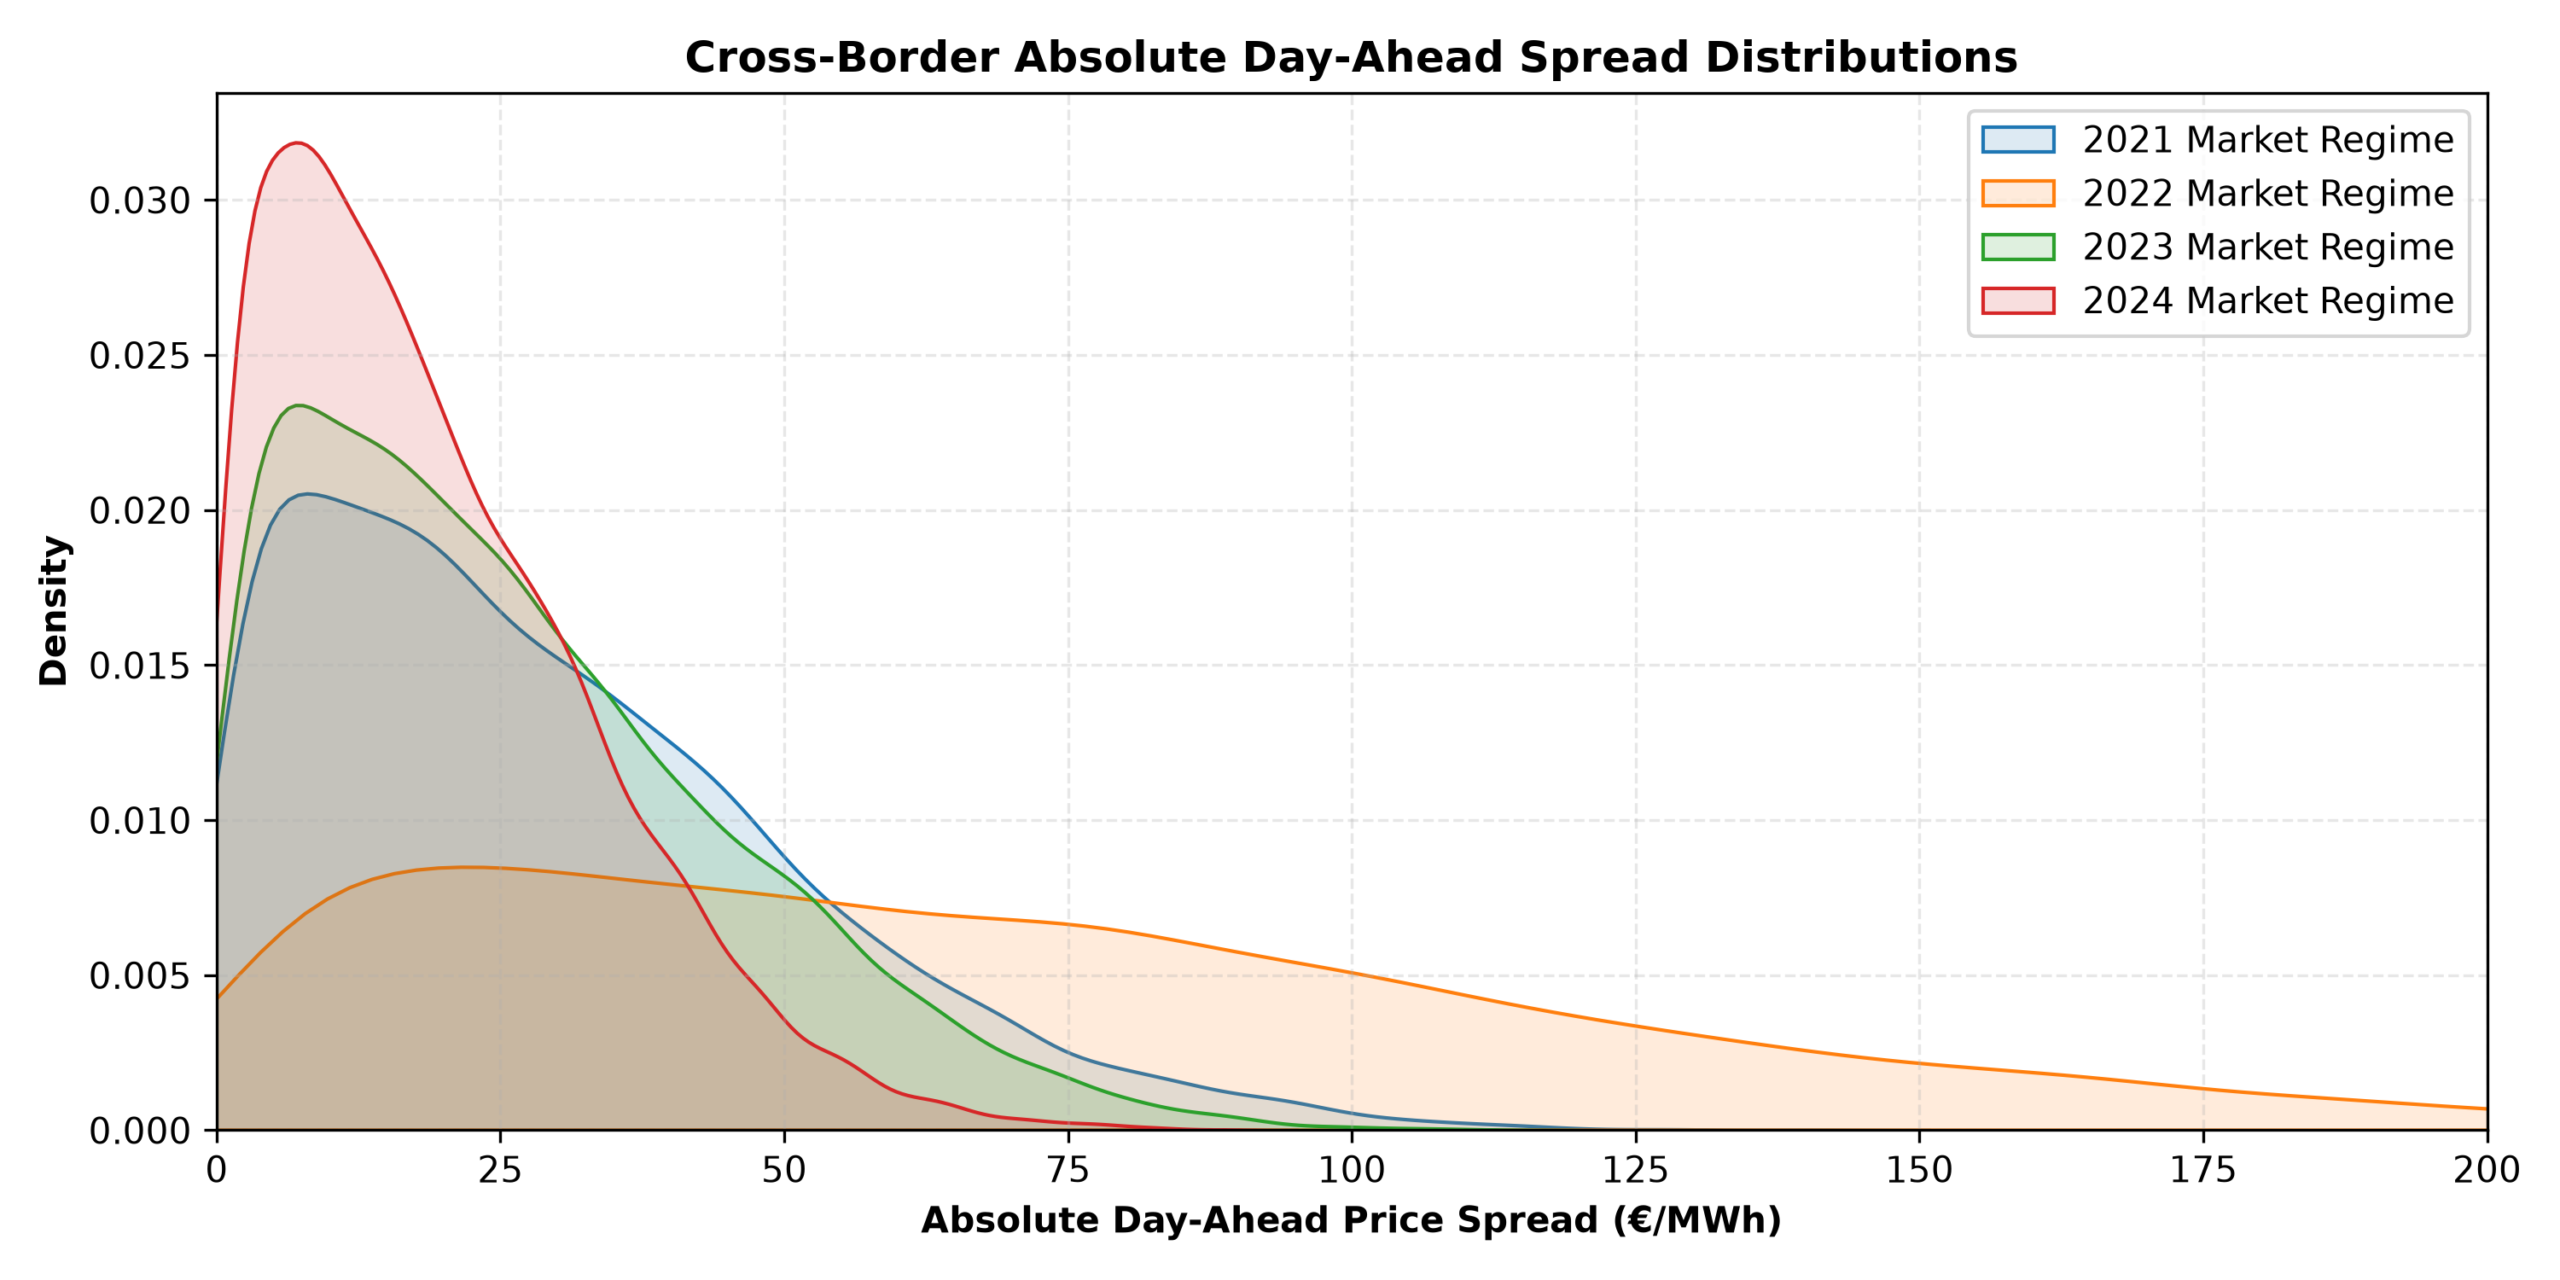
Used python and ENTSO-E data to analyse and visualise the price differential of the NEMO interconnector
Demonstrates use of seaborn and matplotlib, with an overlay of events pulled from a separate excel spreadsheet
Used python and ENTSO-E data to analyse and visualise the price differential of the NEMO interconnector
Demonstrates use of seaborn and matplotlib, with an overlay of events pulled from a separate excel spreadsheet